Introduction
Many organizations struggle with a recurring and costly problem: slow decision-making combined with inefficient operations that inflate costs and reduce customer satisfaction. This article explains how strategic process improvement techniques—such as Lean, Six Sigma, SWOT and PESTEL analysis, and KPI-driven performance management—help professionals diagnose and fix that problem. You will get a clear, practical view of one specific problem, a hypothetical work example, and actionable next steps you can apply immediately.
The specific problem: slow decisions and escalating operational costs
In practice, the problem often appears as delays in approving projects, repeated rework in production or services, and mismatched priorities across teams. These symptoms interact: slow decisions stall improvements; poor processes create defects or rework that burden decision-makers with fire-fighting; and lack of aligned performance measures means teams optimize local metrics rather than overall value.
Why this becomes strategic, not just operational
When delays and inefficiency persist, they hinder strategic goals: revenue growth is constrained, margins shrink, and the organization loses agility in responding to market shifts identified through PESTEL factors. Addressing only tactical fixes (e.g., hiring more staff) usually fails because root causes are systemic—process design, unclear roles, poor data for decisions, or misaligned incentives.
Practical framework to diagnose and act
Use a structured approach combining strategic analysis and process improvement:
- Environmental scan (PESTEL): Identify external forces creating urgency—regulatory change, technological shifts, or economic pressures.
- Internal diagnosis (SWOT): Map strengths and weaknesses in decision governance, process capability, and data systems.
- Process mapping (Lean): Visualize end-to-end workflows to find delays, handoff wastes, and non-value activities.
- Variation and defects analysis (Six Sigma): Quantify where errors and rework occur and measure their impact on cost and time.
- Performance design (KPIs and Balanced Scorecard): Define a small set of metrics that align daily decisions with strategic objectives.
How these pieces work together
PESTEL and SWOT make the problem strategic by clarifying why speed and cost matter to long-term goals. Lean and Six Sigma provide tools to redesign processes and reduce variation. KPIs ensure that improvements are sustained and that decisions are guided by leading indicators rather than ad hoc judgment.
Hypothetical work example: the procurement bottleneck
Imagine a mid-sized manufacturing firm where new supplier approvals take 6–8 weeks. Production waits, expedited shipping is frequent, and inventories spike—raising costs. Leadership notices missed delivery promises and rising procurement expenses.
- PESTEL insight: New import tariffs and supply-chain disruption increase the cost of delays.
- SWOT diagnosis: Strength: strong supplier relationships; Weakness: decentralized approval workflows; Opportunity: digitize approvals; Threat: competitor with faster sourcing.
- Lean mapping: A value-stream map shows multiple handoffs between purchasing, quality, and legal, with redundant document checks causing two-week pauses.
- Six Sigma analysis: Data on approval times reveals that 70% of delays trace to inconsistent documentation—high variation that can be reduced with a standardized checklist.
- KPI realignment: Shift from measuring number of approvals processed per week to cycle time for supplier onboarding and percentage of onboarding completed without rework.
Actions that follow from this diagnosis might include implementing a standardized onboarding checklist, defining clear decision authority thresholds, automating document routing, and tracking onboarding cycle time monthly. Within three months, the organization can reduce onboarding time from 6–8 weeks to 10–14 days, lower expedited shipping costs, and restore production schedules.
Actionable takeaways you can apply this week
- Map a single high-impact process end-to-end (use a simple whiteboard or digital flowchart). Focus on handoffs and waiting times.
- Collect basic cycle-time data for that process for two weeks—start, stop, and rework counts. Even small datasets reveal major patterns.
- Run a quick SWOT: identify one internal weakness causing delay and one external factor that makes speed important.
- Define 2 KPIs: a cycle-time metric and a defect/rework rate tied to that process. Share them with the team and review weekly.
- Implement one small Lean change (e.g., a checklist or single-authority signoff) and measure its effect after two weeks.
Next steps and further learning
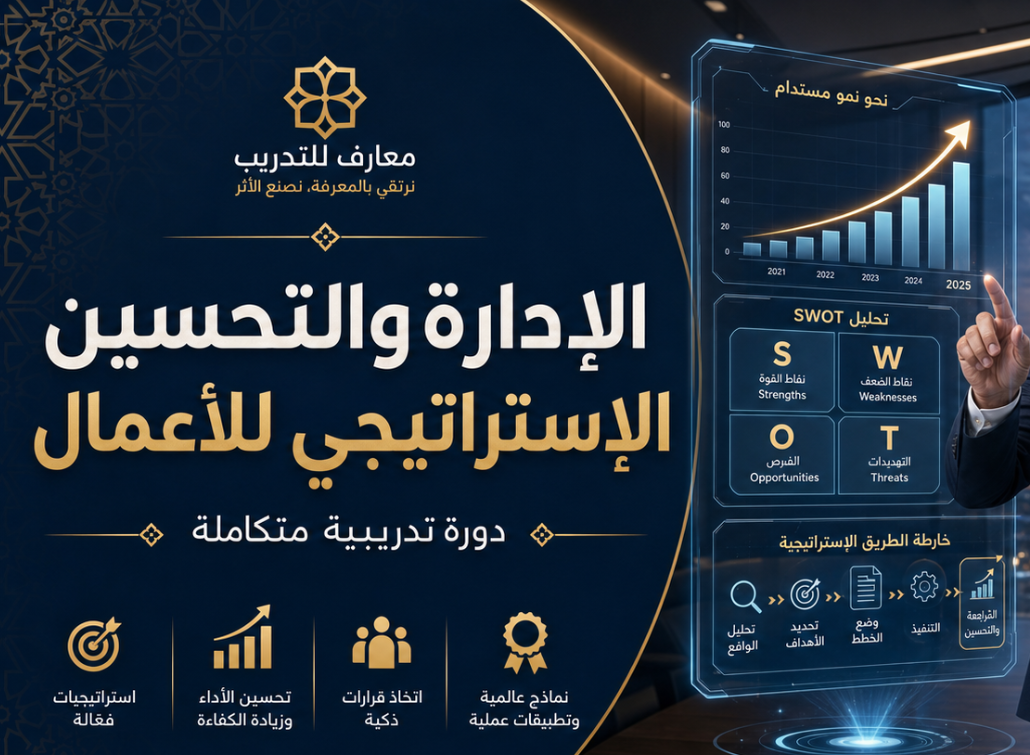
If you want a structured, end-to-end approach that teaches these tools and how to apply them together—SWOT and PESTEL for strategy, Lean and Six Sigma for process improvement, and KPIs for sustained performance—consider a focused course that covers these methods and practical application. Easy Path Uni offers a course titled الإدارة والتحسين الإستراتيجي للأعمال that covers these topics and includes guidance on aligning process improvements with strategic goals. Learn more at the course page.
Addressing slow decision-making and high operational costs requires both strategic clarity and practical process tools. Start with a focused diagnosis, implement a small change, measure impact, and scale what works. These steps will convert an entrenched problem into an opportunity for sustainable improvement.
Next step: View the course details and start learning.